Ice loss following the collapse of Antarctic ice shelves
An international team of researchers has combined data from multiple sources to provide the clearest account yet of how much glacial ice surges into the sea following the collapse of Antarctic ice shelves.

The work by researchers at the University of Maryland, Baltimore County (UMBC), the Laboratoire d’Etudes en Géophysique et Océanographie Spatiales, Centre National de la Recherche Scientifique at the University of Toulouse, France, and the University of Colorado’s National Snow and Ice Data Center, Boulder, Colo. details recent ice losses while promising to sharpen future predictions of further ice loss and sea level rise likely to result from ongoing changes along the Antarctic Peninsula.

An ice shelf is a thick floating tongue of ice, fed by a tributary glacier, extending into the sea off a land mass. Previous research showed that the recent collapse of several ice shelves in Antarctica led to acceleration of the glaciers that feed into them. Combining satellite data from NASA and the French space agency CNES, along with measurements collected during aircraft missions similar to ongoing NASA IceBridge flights, Shuman, Etienne Berthier of the University of Toulouse and Ted Scambos of the University of Colorado produced detailed ice loss maps from 2001 to 2009 for the main tributary glaciers of the Larsen A and B ice shelves, which collapsed in 1995 and 2002, respectively.

The approach they took drew on the strengths of each data source to produce the most complete picture yet of how these glaciers are changing, noting that the study relied on easy access to remote sensing information provided by NASA and CNES. The team used data from NASA sources including the MODerate Imaging Spectroradiometer (MODIS) instruments and the Ice, Cloud and land Elevation Satellite (ICESat).

The analysis reveals rapid elevation decreases of more than 500 feet for some glaciers, and it puts the total ice loss from 2001 to 2006 squarely between the widely varying and less certain estimates produced using an approach that relies on assumptions about a glacier’s mass budget. The authors’ analysis shows ice loss in the study area of at least 11.2 gigatons per year from 2001 to 2006. Their ongoing work shows ice loss from 2006 to 2010 was almost as large, averaging 10.2 gigatons per year.
This study shows where the tracking of sea level rise is heading. Glacier changes can start fast, with a single climate or ocean ‘bang,’ but they have a long persistence. (NSIDC)

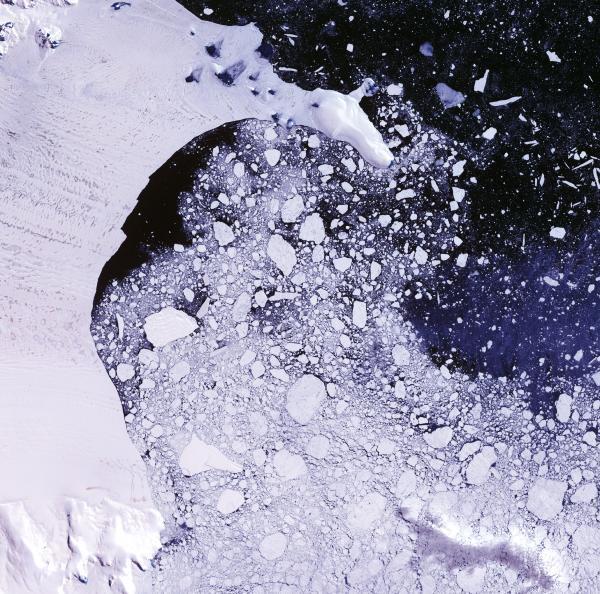
2001–2009 elevation and mass losses in the Larsen A and B embayments, Antarctic Peninsula
Christopher A. SHUMAN, Etienne BERTHIER, Ted A. SCAMBOS
Press release: New study details glacier ice loss following ice shelf collapse
Predicting sea level rise: Understanding how icebergs form could lead to better forecasts
Commenting rules and guidelines
We value the thoughts and opinions of our readers and welcome healthy discussions on our website. In order to maintain a respectful and positive community, we ask that all commenters follow these rules:
We reserve the right to remove any comments that violate these rules. By commenting on our website, you agree to abide by these guidelines. Thank you for helping to create a positive and welcoming environment for all.