Japan – one year after the mega quake – more than 19000 lives lost, 1.2 million buildings damaged, $574 billion…
Be it scalar weapon attack, mini nukes in fracture zones or natural occurence the Great Tohoku earthquake or 3/11 Japan earthquake and tsunami generated by it made enormous material damage, took many lives and still threatens to take many more.
One year after the mega quake
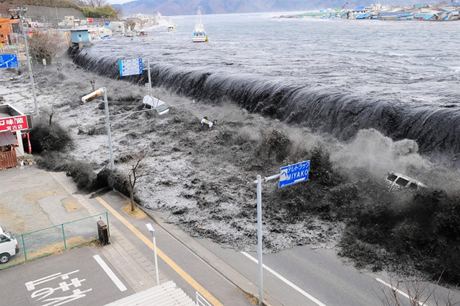
On March 11, 2011, a 9.0 magnitude earthquake struck 120 km (75 miles) off the eastern coast of Japan. Almost immediately, tsunami warnings blared, urging residents along Japan’s coast to quickly move to higher ground. For the next several hours, residents watched in stunned horror as a series of massive waves slammed into the coast, inundating entire towns and sweeping across the countryside, laying waste to everything in its path.
The earthquake hit a highly populated area in terms of world standards (around 100-500 people per sq. km.), but a lowly populated area of Japan with the exception of the Sendai area. The tsunami spread across the whole eastern coast and the Pacific ocean, causing damage up to 10km inland in a couple of places, but mostly along the direct 1km of coast removing already damaged earthquake debris and causing more housing collapses.
Most of the buildings are wooden in the affected area, with some concrete and steel buildings making up the mix. The area contributes to between 7-9% of Japan’s GDP when including the 4 prefectures most affected.
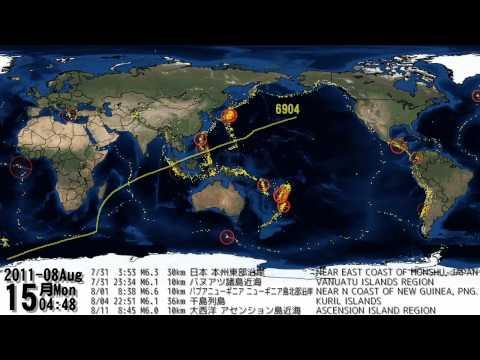
World earthquakes 2011 visualization map
Deaths and Injuries
The current FDMA and prefectural losses (CATDAT Report 50) gives 16273 dead, 3061 missing (a total of 19334). 27074 people were injured (with numbers still being counted).
This value still differs from the NPA giving a total of 15854 dead, 3167 missing (a total of 19021).
From this earthquake, the total shaking deaths are currently estimated at around 265.
The deaths from fire are at around 165 and the confirmed tsunami drownings at 14308 according to data released by the NPA out of 15308 confirmed bodies. 478 bodies are still yet to be identified.
It can be seen that many people missing have been found since the start of April 2011, meaning that we are now (March 2012) around 19000 dead and missing as a result of this earthquake and tsunami. Much lower than the 30000 expected in late March.

Ishinomaki City in Miyagi had the most fatalities with around 3735 currently expected (around 2.2% of the population). Otsuchi Town had the highest percentage of the population killed from any municipality (9.3%, 1286 deaths). The percentages on the right hand side show the killed population as a percentage of the total daytime population. The red shows the people confirmed dead, and the black shows the missing people (presumed dead).
It is interesting to see that Minamisanriku – where over 10000 people were reported to be killed as a result of the tsunami in the first 24 hours, has had less than 1000 dead and missing.
The highest proportion of dead and missing is of course in the coastal regions in Iwate, Miyagi and Fukushima. It would be useful to know what the cause of each death was and we expect this information will come at some point.
Age played a major role in the survival chances of people therefore escaping the tsunami, as people become older, they lose the ability and drive to escape in many cases. They will also move to save their families before themselves to a greater extent (usually!). The final predicted death percentages are as follows based on data from NPA from March 2011 to March 2012. Over 90% of the stress and chronic disease deaths (of which around 600 are expected (570 were counted as of mid-2011)), have come from elderly people over the age of 65.
In addition around 56% of the dead were over 65 years old.
Around 27000 people have been reported to be injured as a result of this earthquake and tsunami, showing the large impact of the tsunami in killing people versus injuring people but this injury count is expected to rise to 50000 once finalised.
Building and infrastructure losses
As of March 10th, 2012, over 1.2 million buildings had been damaged by the tsunami and earthquake. When dividing these into coastal and non-coastal municipalities the following distribution results. It should be noted that coastal municipalities generally go much inland, and a much greater percentage was not impacted by the tsunami, than was.
|
Buildings
|
Destroyed
|
Partially Destroyed
|
Partially Damaged
|
|
Coastal Municipalities
|
121769
|
190526
|
295087
|
|
Non-Coastal Municipalities
|
7761
|
63575
|
406778
|
|
TOTAL
|
129530
|
254101
|
701865
|
In addition around 120000 additional buildings have been either flooded (with minimal damage) or are non-dwelling buildings damaged (with many still to count).
Over 1,200,000 buildings have been damaged in total from the earthquake, tsunami and associated aftershocks.
As of March 10th, 2012, 3918 roads have been reported to be damaged, 78 bridges, 45 dikes and 29 railway locations. In addition around 200 landslides have been reported. The data seems to be incomplete however from many locations, as Chiba has reported 2343 damaged roads, with other prefectures where much shaking occurred reporting much less damage. Most of this damage was caused by liquefaction
Around 360 fires were extinguished by the fire department.
|
Buildings
|
Destroyed
|
Partially Destroyed
|
Partially Damaged
|
|
Tsunami
|
104020
|
111317
|
67329
|
|
Earthquake
|
25510
|
142784
|
634536
|
An additional 35466 buildings are in the towns and cities within the exclusion zone of the Fukushima I and II nuclear sites.
The best estimate of damage to buildings from Daniell et al. (2011) coming from each of the three events is the earthquake (42%), tsunami (39%) and nuclear disaster (19%).
The following diagram shows the relative impact of the earthquake vs. the tsunami in each location.

Economic loss estimates
The economic loss estimates from CATDAT were distributed on earthquake-report.com with the release of $100 billion to $500 billion estimate (total, with 70% coming from tsunami), created after 70 minutes.
In total, one year after the event, reasonable estimates for the earthquake and tsunami direct economic loss is between $237 billion and $303 billion with around $275 billion USD the median estimate. In addition, around $65 billion USD direct damage occurred as a result of the powerplant incident in Fukushima.
Indirect losses could be in the order of $185 to 345 billion across the earthquake, tsunami and powerplant.
Without the tsunami, the earthquake would still have caused 40-45% of the total damage seen.
|
In Billion USD
|
Earthquake
|
Tsunami
|
Powerplant
|
|
Direct Loss Inland
|
77
|
0
|
30-41
|
|
Direct Loss Coastal
|
48-81
|
112-145
|
28-30
|
|
Total Direct Loss
|
125-158 (42%)
|
112-145 (39%)
|
58-71 (19%)
|
|
Indirect Economic Loss
|
69-132
|
64-113
|
51-91
|
|
Total Economic Loss
|
194-290 (41%)
|
176-258 (36%)
|
109-162 (23%)
|
From historical quakes and looking at business interruption, for a $280 billion direct economic loss from this earthquake, around $110 billion (2-yr) to $220 billion (5-yr) in extra indirect losses could be expected. Further analysis will be needed over the coming years.
This is the highest economic loss from any earthquake historically, eclipsing the approximately $210-280 billion loss (2012-adjusted) from the 1923 Great Kanto Earthquake.
Find more statistics and tables used in the article here: www.earthquake-report.com
Shelter and homeless
The peak number of homeless and people living in shelters is hard to calculate given incomplete data in the first few days. It was likely that a total of around 700000 people were living outside of their homes on the 12thMarch, however data is lacking. In Miyagi for instance, the total in shelters was counted at 45979 at 5.00am JST on the 12th March, but was then counted at 320885 at 16.00 JST on the 14th March. In Ibaraki prefecture, a peak of 72000 people in shelters was seen at 12/03/2011 at 8.00am when the shelters opened, and then reduced after that.
Around 400,000 people are expected to be homeless as a result of this earthquake (due to destroyed buildings or forced evacuation).
When looking at the total impact in Fukushima with the forced evacuations due to the nuclear plant, once all people were found and those who evacuated were counted, the total of the population who went to shelters and other prefectures was around 134000 people of which around 90000-110000 were evacuees of the Fukushima plant disaster and between 24000 and 44000 were probably earthquake and tsunami impacted. Other influences may have included the gas, water and power outages, landslides and torrential rain that were also present.
As of 10th March 2012, around 56,000 people are living outside the prefecture from Fukushima, and around 50,000 internally (of which at least 42,000 are from the nuclear affected towns).
Fukushima nuclear crisis is still ongoing. Damage from destroyed nuclear plant will be still be assessed in coming years.
Source: www.earthquake-report.com
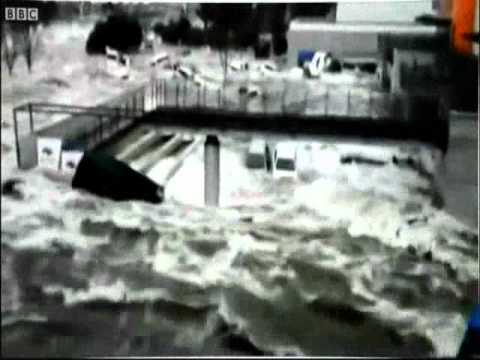
The most shocking video of the tsunami in Japan

Japan tsunami street footage

Town of Miyako wiped out -10000 feared dead
Commenting rules and guidelines
We value the thoughts and opinions of our readers and welcome healthy discussions on our website. In order to maintain a respectful and positive community, we ask that all commenters follow these rules:
We reserve the right to remove any comments that violate these rules. By commenting on our website, you agree to abide by these guidelines. Thank you for helping to create a positive and welcoming environment for all.