State of global temperatures in 2012
According to the World Meteorological Organization, the first ten months of 2012 indicate that it will most likely be the ninth warmest on record (since records began in 1850), despite the cooling influence of La Niña early in the year. The presence of a La Niña during the start of a year tends to have a cooling influence on global temperatures. The six-month average of May–October 2012 was among the four warmest such periods on record. The current 2012 global land and ocean surface average temperature is 14.45 °C, which is 0.45 ± 0.10 °C above the 1961-1990 average of 14.2°C.
Notable extreme events were observed worldwide, but some parts of the Northern Hemisphere were affected by multiple extremes during January – October 2012.

WMO’s provisional annual statement on the state of the global climate highlighted the unprecedented melt of the Arctic sea ice and multiple weather and climate extremes which affected many parts of the world. The alarming rate of Arctic sea ice melt this year show the far-reaching changes taking place on Earth’s oceans and biosphere. The 2012 minimum sea ice extent was 49% or nearly 3.3 million square kilometers (below the 1979–2000 average minimum). Some 11.83 million square kilometers of Arctic ice melted between March and September 2012.
The provisional statement is being released at the 18th Conference of the Parties to the United Nations Framework Convention on Climate Change, taking place in Doha, Qatar. WMO released its annual Greenhouse Gas Bulletin 21 November. It is available at WMO Global Atmosphere Watch Programme Web page.
 Global near-surface temperatures from 1850 to 2012 (Credit: Met Office Hadley Centre/Climatic Research Unit HadCRUT4, NASA GISS and NOAA NCDC)
The WMO global temperature analysis is based on three complementary datasets. One is the combined dataset maintained by both the Hadley Centre of the UK Met Office and the Climatic Research Unit, University of East Anglia, United Kingdom. Another dataset is maintained by the National Oceanic and Atmospheric Administration (NOAA), and the third one is from the Goddard Institute of Space Studies (GISS) operated by the National Aeronautics and Space Administration (NASA). Additional information is drawn from the ERA-Interim reanalysis-based data set maintained by the European Centre for Medium-Range Weather Forecasts (ECMWF).
A 10-year report on the state of the climate, “2001-2010, A Decade of Extremes” is scheduled for release on 4 December 2012. This report highlights the warming trend for the entire planet, its continents and oceans during the past decade, with an indication of its impacts on health, food security and socio-economic development. Final figures for the whole of 2012 will be available in March 2013.
Temperatures
During the first ten months of 2012, above-average temperatures affected most of the globe’s land surface areas. The strongest impact was recorded in North America, southern Europe, western and central Russia and northwestern Asia. Much of South America and Africa experienced above average temperatures during the first ten months of the year, with the most anomalous warmth across parts of northern Argentina and northern Africa. Much of Asia had above-average temperatures, with cooler-than-average conditions across parts of northern China. South Asia and the Pacific were also predominantly warmer than normal, except for Australia.
 HadCRUT4 includes up-to-date data available from land stations, new data from higher-latitude stations giving better coverage of Arctic climate, and improved and more extensive sea surface temperature data. (Credit: Met Office and the University of East Anglia)
Heat waves
Northern Hemisphere was impacted by major heatwaves during the year, with strongest influence across the continental USA and Europe in March – May period. Warm spells during March 2012 resulted in many record-breaking temperatures in Europe and nearly 15,000 new daily records across the USA. For Russia, this was the second warmest summer on record after 2010. Numerous temperature records were broken in Morocco in summer.
Drought
According to the U.S. Drought Monitor report from September 25, 2012, nearly 65.5% of the continental United States was considered to be in moderate to exceptional drought conditions. Western Russia and western Siberia experienced drought conditions during June and July, and Southeast Europe, the Balkans and some Mediterranean countries during summer. Chinese Yunnan and southwestern Sichuan province experienced severe drought during winter and spring. The worst drought in 50 years affected northern regions of Brazil. The April–October precipitation total, Australia had 31% below normal total precipitation amount through April – October period.
Floods
Devastating monsoonal floods continued to impact Pakistan this year during September. Parts of southern China experienced their heaviest rainfall in the last 32 years in April and May. Central and parts of northern Argentina suffered from record rainfall and flooding in August, and parts of Colombia were affected by heavy precipitation for most of the year. Many parts of western Africa and the Sahel, including Niger and Chad, suffered serious flooding between July and September because of a very active monsoon. Heavy rainfall from the end of July through early October prompted exceptional floods across Nigeria.
Snow and Extreme Cold
A cold spell on the Eurasian continent from late January to mid-February was notable for its intensity, duration, and impact. Across eastern Russia, temperatures ranged between -45°C to -50°C during the end of January. Several areas of eastern Europe reported minimum temperatures as low as -30°C, with some areas across northern Europe and central Russia experiencing temperatures below -40°C.
Tropical Cyclones
2012 saw a total of 81 tropical cyclone storms, which is near the 1981–2010 average of 85 storms. The Atlantic basin experienced an above-average hurricane season for a third consecutive year with a total of 19 storms, with 10 reaching hurricane status (the most notably being Sandy, which wreaked havoc across the Caribbean and the USA East Coast). Powerful typhoons severely impacted East Asia( with Typhoon Sanba being the strongest cyclone).
Sources: World Meteorological Organisation, MetOffice
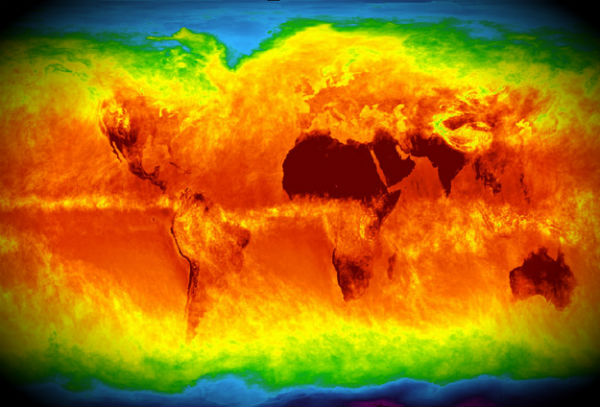
Featured image: Courtesy AIRS Science Team, NASA/JPL, by way of the Earth Observatory.
The changing status of the sun has influenced the jet stream. In turn, the oceans warmer currents have invaded the Arctic waters thinning the sea ice. The MET office temperature results for the past 15 years or so indicate little global warming. The time lapse photos of the Arctic show little difference in the Arctic ice coverage for the last several years with no sudden drop in winter ice. However, this says nothing about the difference in thickness or mass of the ice. Photos can not show this. The Arctic ice coverage looks almost identical for each year’s growth and decline of the icecap. Meanwhile, the Antarctic icecap is increasing. The total Arctic and Antarctic ice caps combined have remained essentially steady for the last several decades.
[…] Earth On Fire https://watchers.news/2012/11/29/state-of-global-temperatures-in-2012/ […]