Air pollution reached hazardous levels across Southwestern Asia and Middle East
Harsh winter conditions and large increase in natural gas prices have revived the use of coal which led to an enormous jump in pollution levels across the Northern Hemisphere, mainly in Asia and Middle East. When the weather is cold, people burn more fuel to keep warm. In many developing economies, the most widely available fuel is coal, which can produce more particulates and smog-producing compounds than other forms of energy. Mostly during the year, the air higher in the atmosphere is cooler than the air near the ground, allowing warm air to rise and carry pollution up and away from its source. But in the winter, temperature “inversions” can form, where the air near the ground is cooler than the air at altitude. Polluted surface air rises a bit, but then runs into warmer air masses above and stays trapped near the surface.
Winter also can bring strong high pressure systems, which generate less wind and more stable atmospheric conditions that also hold surface air in place. Even geography can concentrate the air pollution. If a city is surrounded by mountains, cold air may continually sink down into the basin and the hills may temper or redirect the winds that can clear the air.
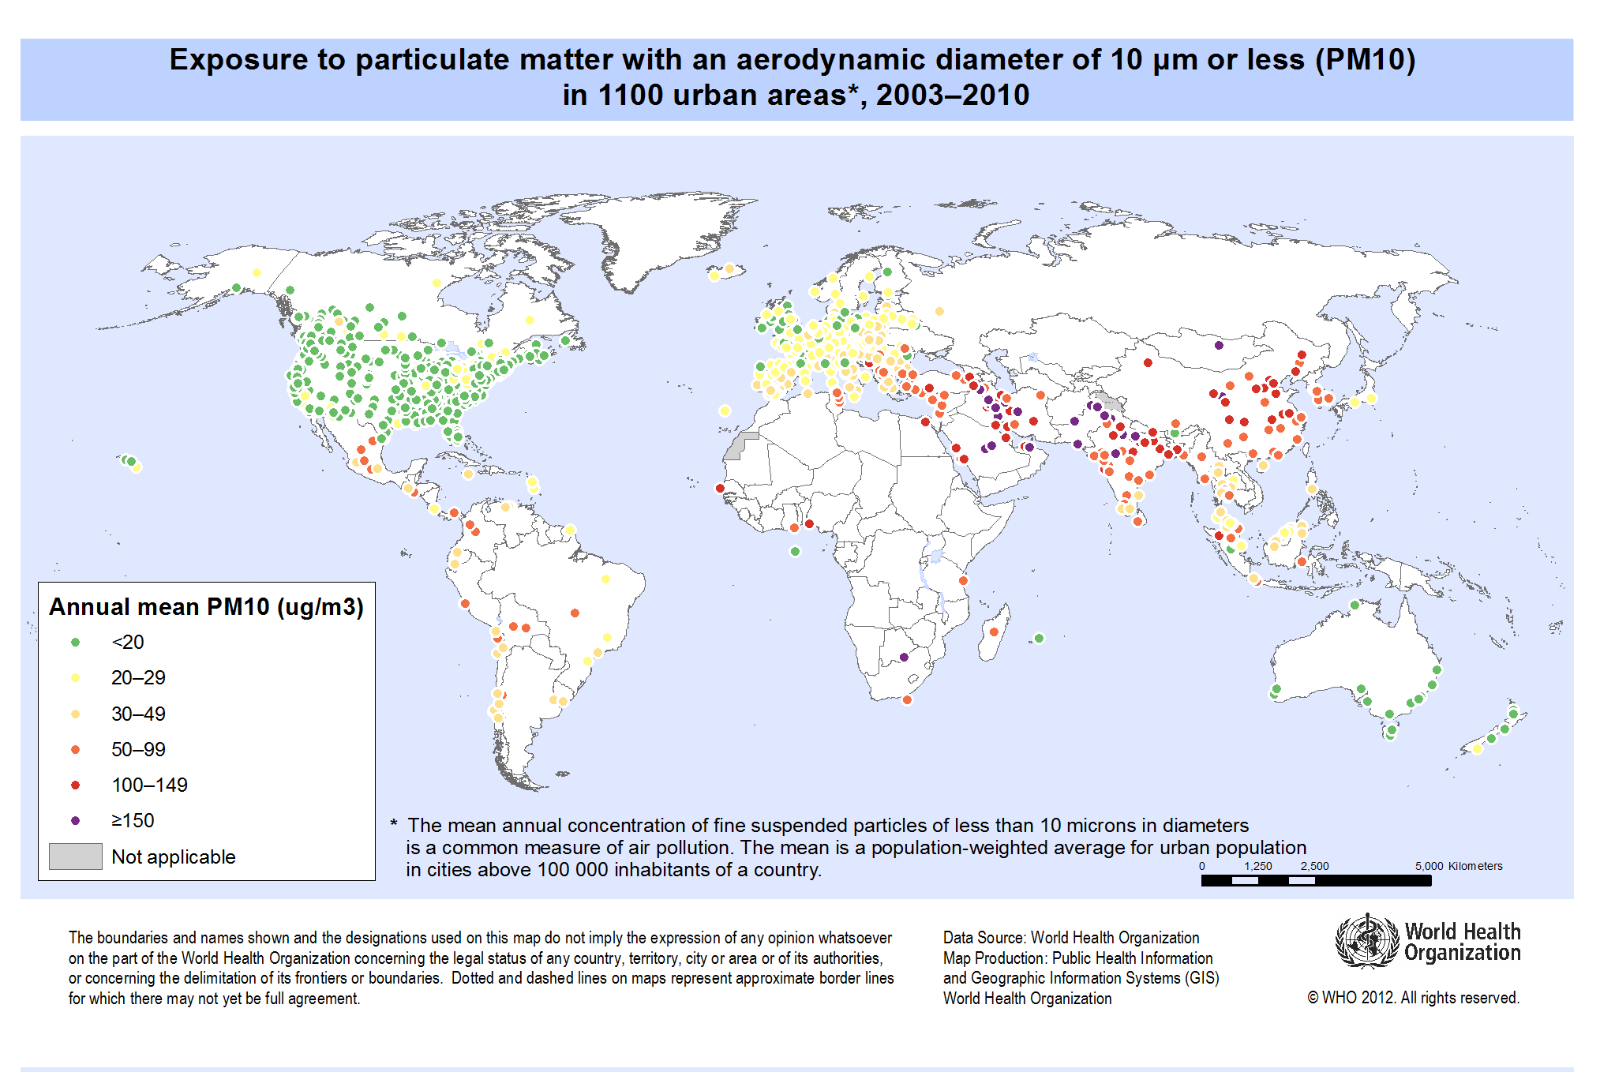 Exposure to particulate matter with an aerodynamic diameter of 10 um or less (PM10) in 1100 urban areas, 2003–2010 (Source: WHO)
Nitrogen dioxide is a key emission from the burning of fossil fuels by cars, trucks, power plants, and factories; the combustion of fuel also produces sulfur dioxide and aerosol particles. When the weather is hot and sunlight strongest, NO2 emissions usually lead to the creation of ground-level ozone. In the winter, NO2 is less likely to breed ozone, but it does linger for a long time and contribute to fine particle pollution.
Alarming situation in Beijing, Ankara, Tehran
According to the World Health Organization (WHO), the acceptable level of pollution per cubic meter is a maximum of 300 micrograms. According to the WHO, 1,000 micrograms of pollution is an alarming level, 2,000 micrograms should be the limit because it can cause death.In 1952, approximately 4,000 people died in London when pollution level rose over 4,000 micrograms per cubic meter. Worldwide, outdoor air pollution contributes to 5% of all cardiopulmonary deaths.
Fine, airborne particulate matter (PM) that is smaller than 2.5 microns is considered dangerous because it is small enough to enter the passages of the human lungs. The World Health Organization considers PM2.5 to be safe when it is below 25. On January 12, PM2.5 in Beijing reached 886 micrograms per cubic meter.
Residents of Beijing and many other cities in China were warned to stay inside in mid-January 2013 as the nation faced one of the worst periods of air quality in recent history. The Chinese government ordered factories to scale back emissions, while hospitals saw spikes of more than 20 to 30% in patients complaining of respiratory issues.
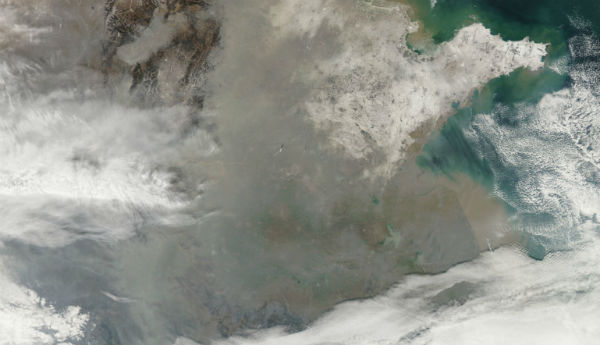
 The Moderate Resolution Imaging Spectroradiometer (MODIS) on NASA’s Terra satellite acquired these natural-color images of northeastern China on January 3, 2013 (left) and January 14 (right) . The January 14 image shows extensive haze, low clouds, and fog over the region. The brightest areas tend to be clouds or fog, which have a tinge of gray or yellow from the air pollution. Other cloud-free areas have a pall of gray and brown smog that mostly blots out the cities below. In areas where the ground is visible, some of the landscape is covered with lingering snow from storms in recent weeks. (NASA image courtesy Jeff Schmaltz, LANCE MODIS Rapid Response. Caption by Mike Carlowicz)
China’s air pollution problem (slideshow)
Air Pollution in China: Real-time Air Quality Index Visual Map
U.S Embassy Beijing Air Quality Monitor
Pollution levels in Ankara, Turkey reached 9,350 micrograms per cubic meter in the Sıhhiye district in early January. According to Dr. Recep Akdur, an expert in public health, this is one of the highest levels in the world’s history. Environment and Forest Ministry stations recorded 5,070 micrograms in Sıhhiye on January 17, 2013. Level of pollution in the Bahçelievler district reached 2,046 micrograms.
A yellowish haze also engulfed Tehran, Iran this January. For nearly a week, officials in Tehran and other large cities have been calling on residents to remain indoors or avoid downtown areas, saying that with air pollution at such high levels, venturing outside could be tantamount to “suicide”. Government offices, schools, universities and banks reopened after the government had ordered them to shut down for five days to help ease the chronic pollution made up of a mixture of particles containing lead, sulfur dioxins and benzene. The haze of pollution occurs every year when cold air and windless days trap fumes belched out by millions of cars and hundreds of old factories between the peaks of the majestic Alborz mountain range, which embraces Tehran.
Iran’s Health Ministry has reported a rise in respiratory and heart diseases, as well as an increase in a variety of cancers that it says are related to pollution.
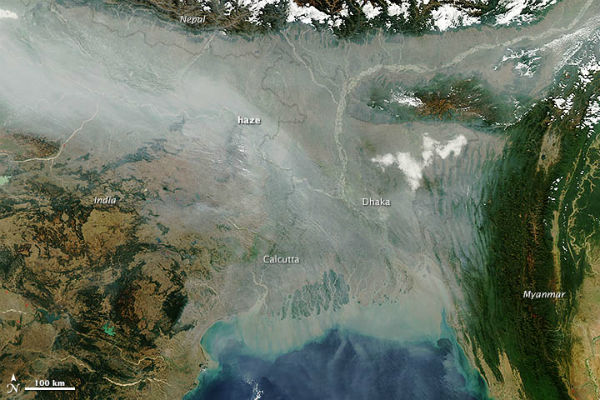 On January 10, the Moderate Resolution Imaging Spectroradiometer (MODIS) on NASA’s Aqua satellite captured this image of haze hugging the Himalayas and spilling out into the Ganges delta and Bengal Sea. (NASA image courtesy Jeff Schmaltz, LANCE MODIS Rapid Response. Caption by Adam Voiland)
As is often the case in the winter, a thick river of haze hovered over the Indo-Gangetic Plain in January 2013, casting a gray pall over northern India and Bangladesh. The haze likely resulted from a combination of urban and industrial pollution, agricultural fires, and a regional meteorological phenomenon known as a temperature inversion. Usually the air higher in the atmosphere is cooler than the air near the surface, a situation that allows warm air to rise and disperse pollutants. However, cold air often settles over northern India in the winter, trapping warmer air—and pollution—close to the surface, where it has the greatest impact on human health.
The polluted air is full of particulate matter, which is easier to spot from the ground but harder to measure from space. Desert landscapes, snow cover, and clouds all make airborne particles difficult to measure with nearly all current satellite instruments. Given that aerosols and NO2 usually arise from the same fuel-burning emissions, the presence of one usually indicates the presence of the other.
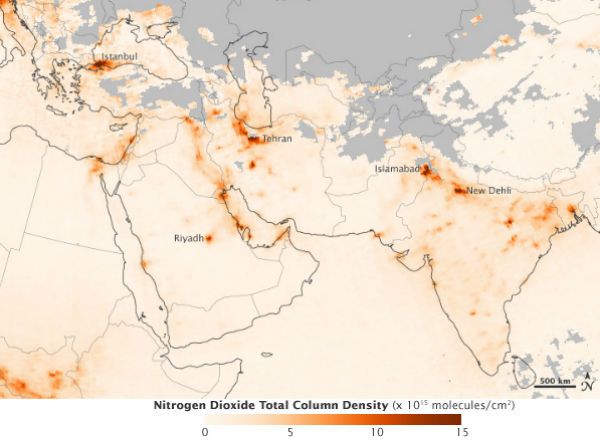 The map above shows the concentration of nitrogen dioxide (NO2) in the atmosphere above southwestern Asia from January 1–8, 2013. Shades of orange reflect the relative abundance of NO2, while grays show areas without usable data (cloud cover, for instance). The data were acquired by the Ozone Monitoring Instrument (OMI) on NASA’s Aura satellite. OMI measures the visible and ultraviolet light scattered and absorbed by Earth’s atmosphere and surface. The presence of NO2 causes certain wavelengths of light to be absorbed. (NASA Earth Observatory image by Jesse Allen, using data provided courtesy of the Aura OMI science team. Caption by Michael Carlowicz)
Daily OMI tropospheric NO2 (air pollution and air quality) satellite measurements over other regions in the world
Sources: Hurriyet Daily, Resalat, Earth Observatory, EPA, WHO, AERONET
Featured image: Thick fog and haze shrouded central and northern parts of China in early January. (Credit: EOSnap/MODIS)
Commenting rules and guidelines
We value the thoughts and opinions of our readers and welcome healthy discussions on our website. In order to maintain a respectful and positive community, we ask that all commenters follow these rules:
We reserve the right to remove any comments that violate these rules. By commenting on our website, you agree to abide by these guidelines. Thank you for helping to create a positive and welcoming environment for all.