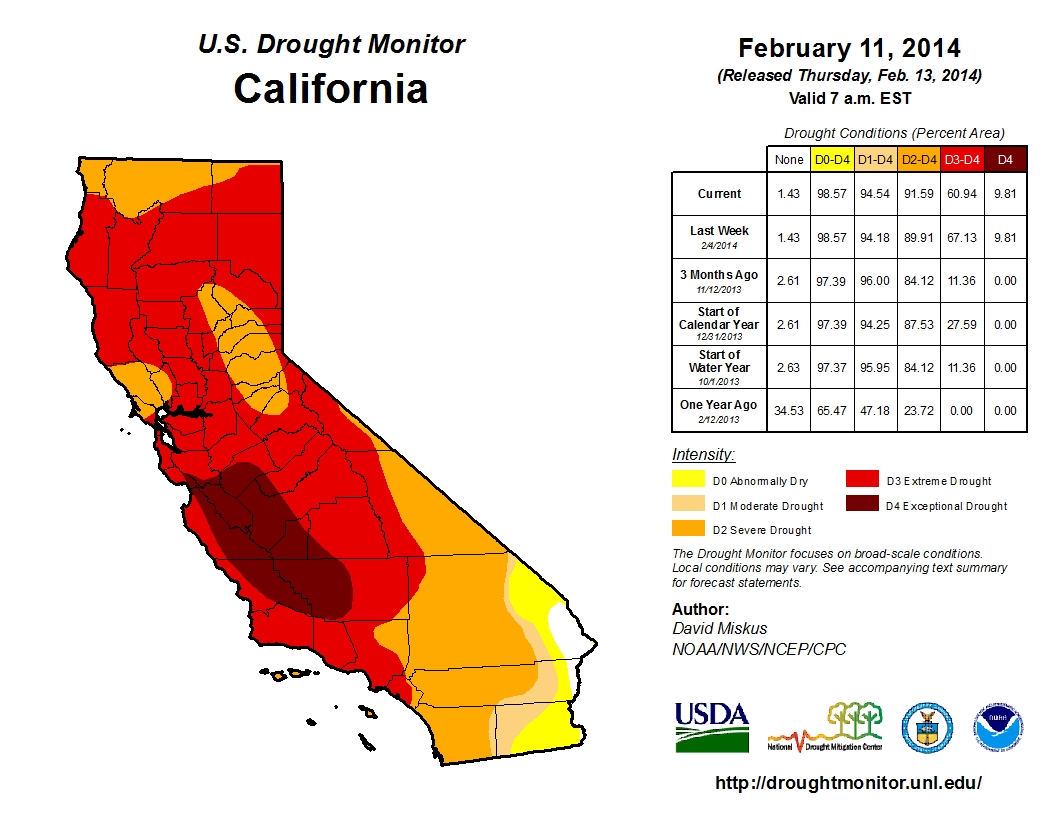
California experiencing its worst drought in over a century
USGS is reporting that the lack of precipitation throughout California for the much of the past three months has only exacerbated the dryness and is causing varying degrees of low levels of streamflow in the northern two-thirds of the state. Low streamflow can affect water availability for agricultural, municipal, and industrial uses, water quality, water temperature, recreational opportunities, and the maintenance of fish populations.
Many of the nearly 500 stream gages are currently at “below normal” or “much-below normal” flows for this time of year. Forty-one low-flow measurements have been made in the northern parts of the state, 12 of which have been measured at record low flows.
- California is experiencing its worst drought in over a century (USGS);
- 2013 went in the record books as the driest calendar year in the state’s 119-year recorded history;
- The past three months (November to January), six months (since August) and twelve months were all the driest periods in California since record-keeping started in 1885. From February 1, 2013, through January 31, 2014, a statewide average of 6.97 inches (177.04 millimeters) of rain fell; the norm is 22.51 inches (571.75 millimeters).
- Though northern and central California received a burst of rain and snowfall in early February, the drought remains deep.
- Without significant precipitation, most streams in the state will be at less than 10% of normal for this time of year.
Water deliveries from the State Water Project and Bureau of Reclamation's Central Valley Project to urban residents and farmers have been severely cut or eliminated in some instances. As of February 12, 2014, the California Department of Water Resources measured the statewide water content of snowpack at only 27% of the average for this time of year. California snowpack melts into streams and reservoirs, providing about one-third of the water used by California's cities and farms.
During periods of drought, groundwater use can increase, but it is generally drawn (in part) from groundwater that may be slow to replenish. Also, once new wells are installed during droughts, it is common for the resulting groundwater-use increases to remain in effect long after the droughts have passed. About 20% of the nation’s groundwater pumping occurs in the Central Valley of California, which contributes to 8% of the country’s agricultural output and 25% of its food source.
Recent precipitation has resulted in some increases in streamflow, snowpack, and reservoir levels, but severe drought conditions remain. Without significant additional precipitation, prior conditions will quickly return leaving most streams in the state at less than 10% of normal for this time of year.
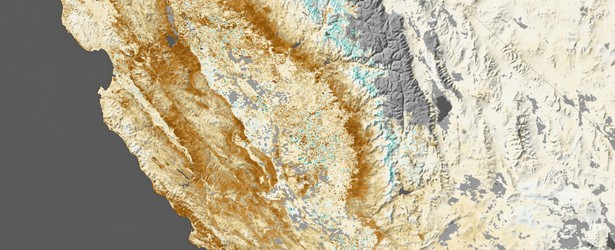
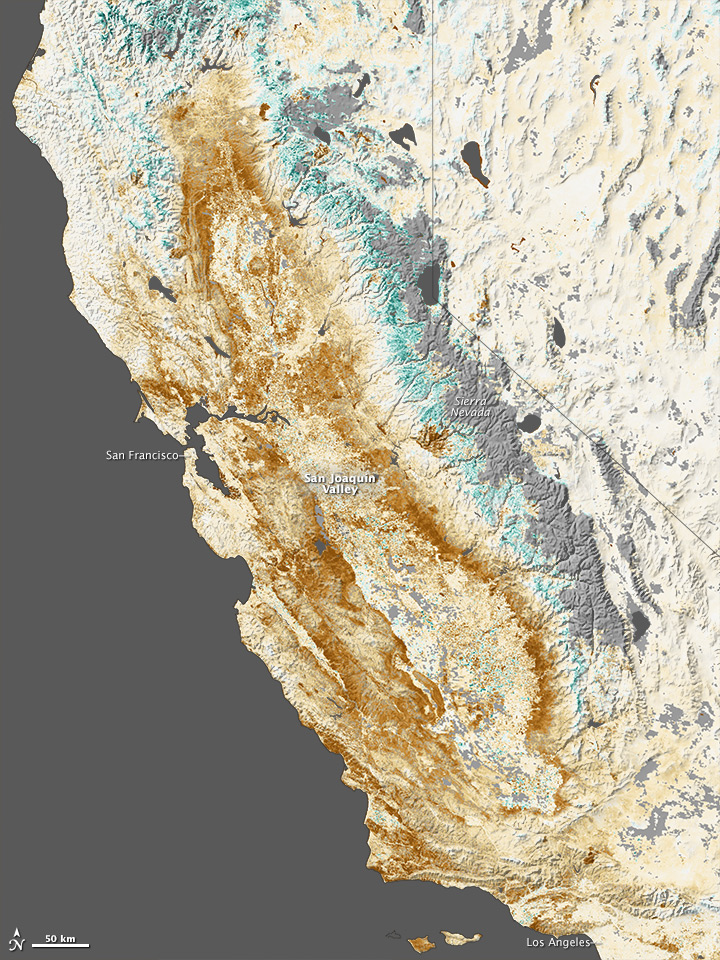
The map below shows the impact of drought on California’s farms, forests, and wild lands. Based on data from the Moderate Resolution Imaging Spectroradiometer (MODIS) on NASA’s Terra and Aqua satellites, the map contrasts plant health from January 17 to February 1, 2014, against average conditions for the same period over the past decade.
NASA Earth Observatory image by Jesse Allen, Earth Observatory, using data provided by Inbal Reshef, Global Agricultural Monitoring Project. Acquired January 17 – February 1, 2014
Shades of brown depict where plant growth, or “greenness,” was below normal for the time of year; shades of green indicate vegetation that is more widespread or abundant than normal. Grays depict areas where data was not available (often due to cloud cover). The map is based on the Normalized Difference Vegetation Index (NDVI), a measure of how plant leaves absorb visible light and reflect infrared light. Drought-stressed vegetation reflects more visible light and less infrared than healthy vegetation.
There is some surprising greenness along the edges of the Sierra Nevada range. “In a normal year, much of the green areas near the mountains would be snow-covered,” said Ramakrishna Nemani, a vegetation sensing expert at NASA’s Ames Research Center. “Since there is not much snow this year, the evergreen vegetation appears anomalously green. In fact, that is bad news for this time of the year.” (EO)
Explore:
- USGS California Water Science Center – Drought
- Drought – The Stealth Disaster (Part 1: Overview)
- Drought – The Stealth Disaster (Part 2: Science for Drought Planning)
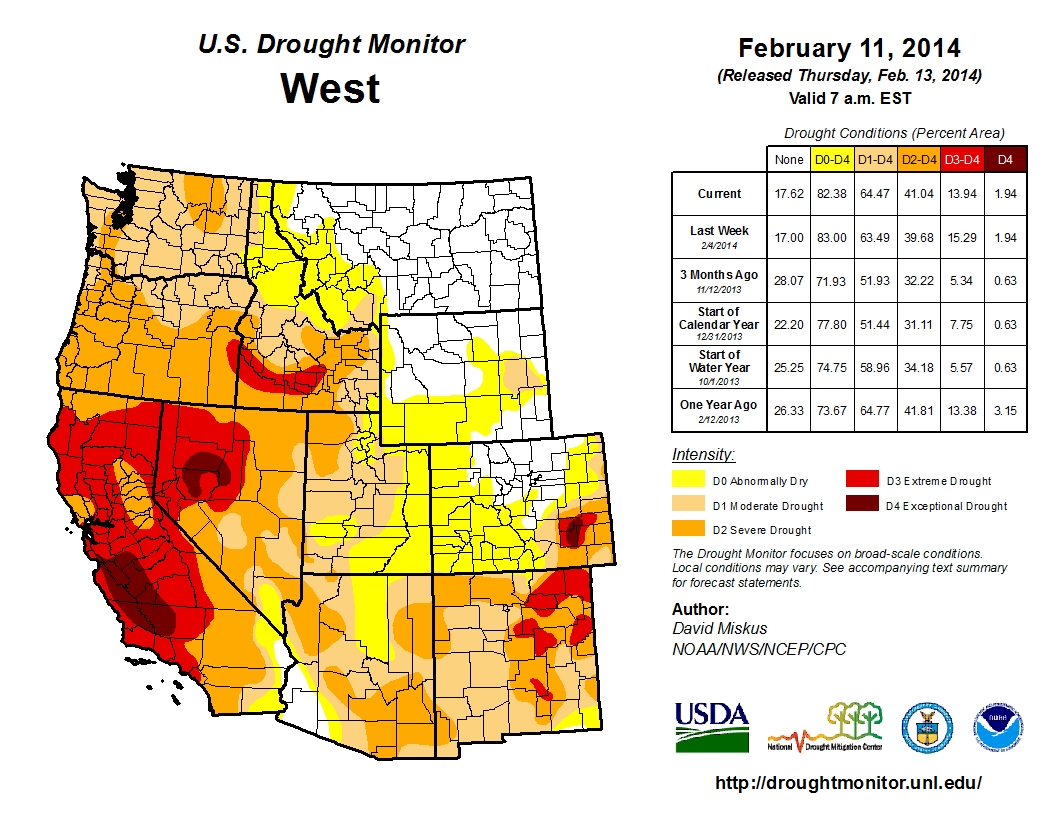
- U.S. Drought Monitor
- USGS Current Streamflow Conditions
- Streamflow Percentiles
Real-Time Data
Groundwater
Surface Water
Water-Quality
Sources: USGS, Earth Observatory,
Featured image: NASA Earth Observatory image by Jesse Allen, Earth Observatory, using data provided by Inbal Reshef, Global Agricultural Monitoring Project.
Commenting rules and guidelines
We value the thoughts and opinions of our readers and welcome healthy discussions on our website. In order to maintain a respectful and positive community, we ask that all commenters follow these rules:
We reserve the right to remove any comments that violate these rules. By commenting on our website, you agree to abide by these guidelines. Thank you for helping to create a positive and welcoming environment for all.