El Niño intensified by the tropical cyclone activity over the western Pacific
The 2015 El Niño event is likely to enhance over the following couple of weeks, as a result of strong tropical cyclone activity, according to the Australian Bureau of Meteorology (BOM).
The US Climate Prediction Centre and The National Centers of Environmental Prediction (NCEO) say: "There is a greater than 90% chance that El Niño will continue through northern hemisphere fall 2015, and around an 85% chance it will last through the 2015-16 winter."
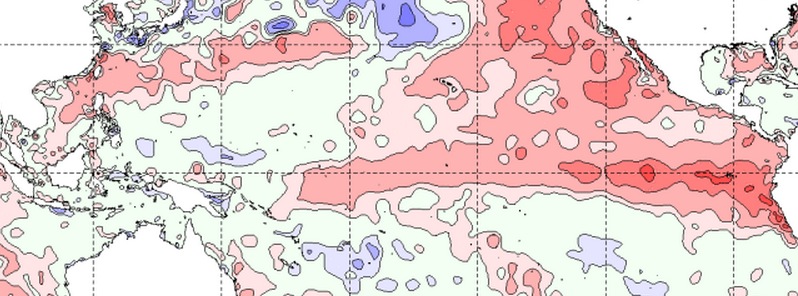
Positive SST anomalies, extending from the South American coastline, across the equatorial Pacific, past the Date line to around 160°E, have been observed for the June 2015.
.gif)
Monthly sea surface temperatures anomalies in the tropical Pacific. Baseline period: 1961–1990. Image credit: BOM
The NINO3.4 index measured +1.3°C for the month of June. The strength of SST anomalies for June, as measured by the NINO3.4 index have set the second warmest June month record, just behind the June 1997 during the 1997/98 El Niño. Climate models indicate that NINO3.4 will remain above El Niño thresholds until at least the end of 2015. The dynamical model average and CPC CON suggest that NINO3.4 will exceed +1.5°C, indicating a "strong" El Niño event later this year.

Image credit: Figure provided by the International Research Institute (IRI) for Climate and Society (updated June 16, 2015).
The Climate Prediction Center and NCEP also report the above average equatorial SSTs across the central and eastern Pacific during last 30 days, ending July 6. According to the report, the largest SST anomaly was observed off the South American coast.
.png)
The Southern Oscillation Index (SOI) 30-day moving average. Image credit: BOM
The Southern Oscillation Index (SOI), measuring the large-scale air-pressure fluctuations between the eastern and western tropical Pacific during during El Niño and La Niña episodes, shows a sharp drop in the last two weeks with the latest 30-day value to July 5 being -16.7. Continuous negative values below -7 usually indicate El Niño event.
5 day SST and wind anomaly. Image credit: BOM
Westerly anomalies over the biggest part of the equatorial Pacific were observed on the trade winds, over the region west of the Date Line, for the 5 days period ending July 5. This intensification can be related to the tropical cyclone activity over the western Pacific.
The El Niño impact on temperatures and precipitation across the United States of America, is expected to be minimal during the summer months on northern hemisphere and to increase into the late fall and winter. Also, the below normal Atlantic hurricane season is expected due to El Niño development, while the above-average hurricane season is expected across the central and eastern Pacific hurricane basins.
Featured image: Sea surface temperature anomaly ending July 5, 2015. Credit: BOM.
Commenting rules and guidelines
We value the thoughts and opinions of our readers and welcome healthy discussions on our website. In order to maintain a respectful and positive community, we ask that all commenters follow these rules:
We reserve the right to remove any comments that violate these rules. By commenting on our website, you agree to abide by these guidelines. Thank you for helping to create a positive and welcoming environment for all.