The 2015 ozone hole over Antarctic larger than usual and late
The annual Antarctic ozone hole was larger than usual this year and formed later than in recent years, according to the scientists from NASA and the National Oceanic and Atmospheric Administration (NOAA). The ozone hole reached its maximum on October 2, 2015, covering the fourth largest area in the period between 1991 and 2014.
The 2015 Antarctic ozone hole peaked on October 2 and remained large throughout the month, setting numerous daily record. At the time of its maximum it spread across 28.2 million square kilometers (10.9 million miles), which is an area larger than the North American continent. Last year, the hole peaked on September 11, covering the area of 24.1 million square kilometers (9.3 million square miles).
Depletion of the ozone layer above Antarctica was first detected during 1980s. The ozone hole forms and expands during the months of August and September due to high concentration of chlorine and bromine molecules in the stratosphere. These molecules are of man-made origin and their concentration in Earth's atmosphere was continually increasing during the early 1990s.
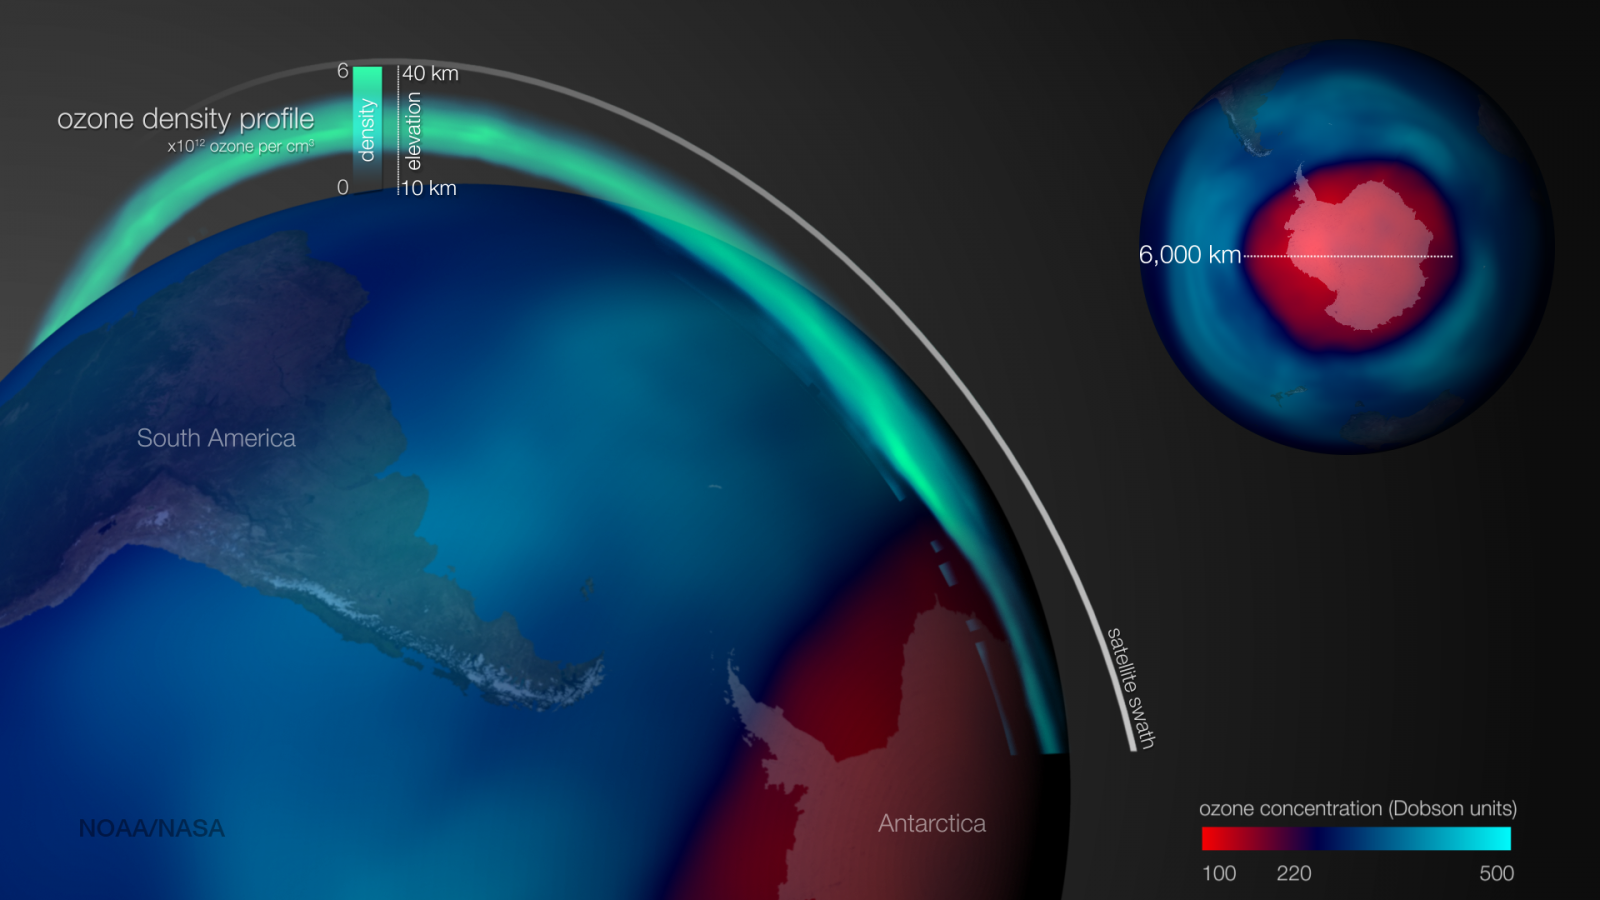
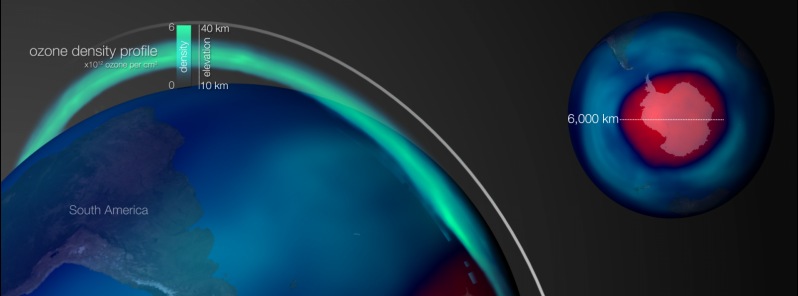
The ozone layer from two perspectives: In the global map, blue colors indicate normal levels of ozone and red colors indicate the area associated with the ozone hole. The vertical profile in green colors shows how the actual thickness of the ozone layer changes, as measured by the OMPS Limb sensor on the Suomi NPP satellite. On October 2nd, as the satellite orbit passed over Antarctica, very low levels and thicknesses of ozone were measured. This depletion can be seen in the vertical profile as a much thinner band of green, and was consistent with balloon sonde measurements from the same time. Image credit: NOAA/NASA
The scientists think this year's hole expanded so much because of the unusually cold temperatures and weak dynamics in the Antarctic stratosphere this year.
"While the current ozone hole is larger than in recent years, the area occupied by this year’s hole is consistent with our understanding of ozone depletion chemistry and consistent with colder than average weather conditions in Earth’s stratosphere, which help drive ozone depletion," said Paul A. Newman, chief scientist for Earth Sciences at NASA's Goddard Space Flight Center in Greenbelt, Maryland.
The minimum thickness of the ozone layer at 101 Dobson units was recorded on October 4, 2015. Before the Antarctic ozone hole developed, Dobson units ranged between 250 and 350. Dobson units are a measure of the overhead amount of atmospheric ozone.
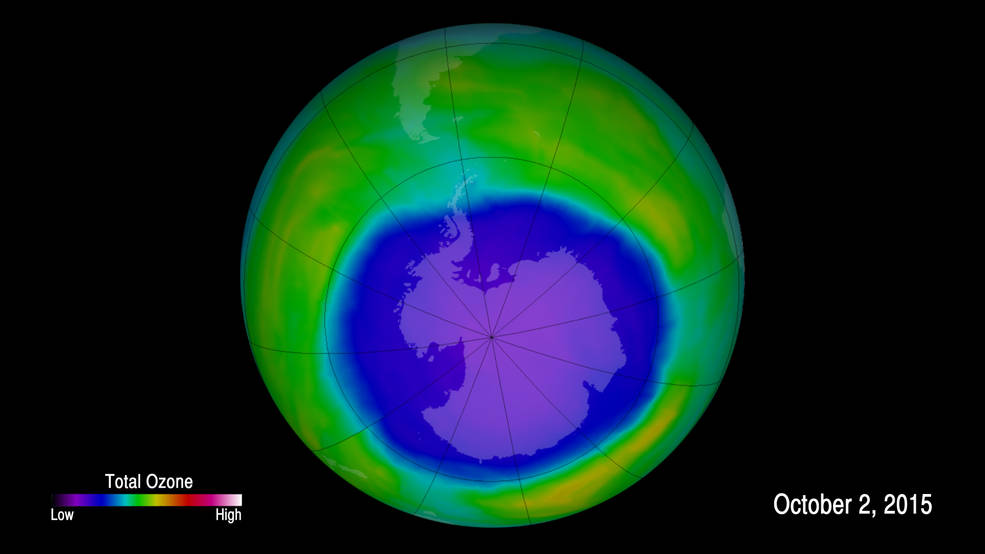
This false-color image shows ozone concentrations above Antarctica on Oct. 2, 2015. Image credit: NASA/Goddard Space Flight Center
The ozone layer is extremely important to our planet, as it shields us from the dangerous ultraviolet radiation, which can cause skin cancer, cataracts, suppress immune systems and damage plants during heightened exposure. The ozone hole of this size is expected to increase Earth's exposure to the ultraviolet rays. This effect will be especially enhanced across Antarctica and the Southern Hemisphere over the coming months.
“This year, our balloon-borne instruments measured nearly 100 percent ozone depletion in the layer above South Pole Station, Antarctica, that was 14 to 19 kilometers (9 to 12 miles) above Earth’s surface,” said Bryan Johnson, a researcher at NOAA’s Earth System Research Laboratory in Boulder, Colorado. “During September we typically see a rapid ozone decline, ending with about 95 percent depletion in that layer by October 1. This year the depletion held on an extra two weeks resulting in nearly 100 percent depletion by October 15."
The internationally agreed Montreal Protocol on Substances that Deplete the Ozone Layer has regulated the ozone-depleting compounds, such as chlorofluorocarbons used in refrigerants and halon gases used as fire suppressants. The ozone depleting compounds are now slowly declining, and the ozone hole is expected to recover by 2070.
Featured image: The ozone layer from two perspectives: In the global map, blue colors indicate normal levels of ozone and red colors indicate the area associated with the ozone hole. The vertical profile in green colors shows how the actual thickness of the ozone layer changes, as measured by the OMPS Limb sensor on the Suomi NPP satellite. On October 2nd, as the satellite orbit passed over Antarctica, very low levels and thicknesses of ozone were measured. This depletion can be seen in the vertical profile as a much thinner band of green, and was consistent with balloon sonde measurements from the same time. Image credit: NOAA/NASA
Commenting rules and guidelines
We value the thoughts and opinions of our readers and welcome healthy discussions on our website. In order to maintain a respectful and positive community, we ask that all commenters follow these rules.