Explosive cyclogenesis with intense low passing through Iceland at peak intensity
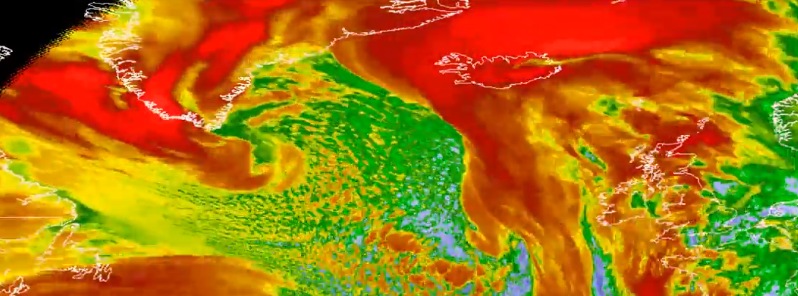
A very strong low pressure system developed over the past couple of days in the North Atlantic. It deepened to a very intense central pressure of 928 hPa at 06:00 UTC on December 30, 2015, and is one of the strongest systems to have impacted the Atlantic in recorded history.
The system rapidly intensified as it strengthened to a hurricane force low pressure system en route to the NE Atlantic producing very high winds and seas.
This video of the enhanced infrared Meteosat-10 imagery and the SEVIRI RGB air mass product shows the entire development of this extremely powerful system.
The associated OPC Atlantic surface analyses are also included at the end of the video.

"From Tuesday evening to Wednesday morning, a mind-boggling pressure drop was recorded in Iceland: 54 millibars [hPa] in just 18 hours. This triples the criteria for 'bomb' cyclogenesis, which meteorologists use to describe a rapidly intensifying mid-latitude storm. A 'bomb' cyclone is defined as dropping one millibar per hour for 24 hours," Angela Fritz, an atmospheric scientist and The Washington Post's deputy weather editor, said.
According to NOAA’s Ocean Prediction Center records, the all-time strongest storm in this area occurred on December 15, 1986, with a minimum central pressure of 900 hPa. The second-strongest storm occurred in January 1993, with a pressure of 916 hPa.
Fritz added this is the same storm that led to two tornado outbreaks in the United States, and disastrous river flooding, that has now pushed the North Pole temperatures above the average for this time of the year.
According to data from the GFS forecast model, on the morning of December 30, temperatures over a vast area around the North Pole were somewhere between -1.11 °C and 1.66 °C (30 and 35 °F), which is 10 °C (50 °F) above the average for this time of year. "This is typical for mid-summer temperatures in this region," Fritz quoted the Capital Weather Gang’s Jason Samenow.
Looking at available measured data, Steve Goddard pointed out the closest buoy never got above -9 °C (15.8 °F).
Video courtesy of NWSOPC / GOES-R Proving Ground
What is happening with methane leak in Cal? It’s important. Read Whitley Striebers
book “The Key”.
No need to mention Goddard/Heller in anything having to do with science or reality, ever.
Best,
D
This is data, not a model. Read the article again.
First of all, what you get from a model is best guess estimates from someones’ best guess estimate on what to include in the models’ construction. Just look at the models predicting the global temps. vs CO2. Ha! That one is laughable. Don’t these guys have any “real” data, as in actual measurements?