The 2015/16 El Niño continues its steady decline
The 2015–16 El Niño continues its slow and steady decline, the Australian Bureau of Meteorology (BOM) reports in their latest ENSO Wrap-Up.
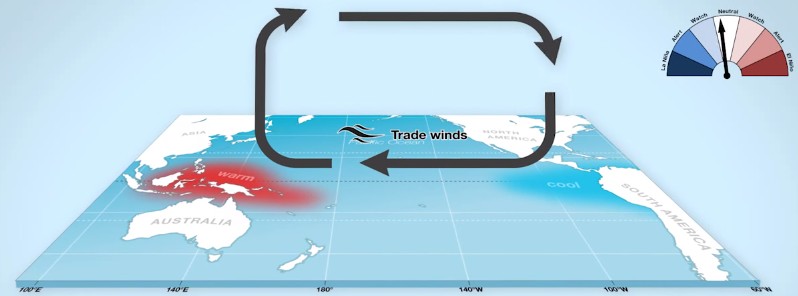
The tropical Pacific Ocean has cooled further over the past fortnight, and trade winds are near normal. "However the Southern Oscillation Index (SOI) remains very low, indicating that while El Niño is easing, it is still capable of influencing Australian and global climate," the Bureau said.
International climate models indicate that cooling in the tropical Pacific will continue, with a likely return to neutral levels by mid-2016. Climate models favour ENSO neutral slightly ahead of La Niña, however, the accuracy of forecasts made at this time of year are lower than those at other times, and some caution should be exercised.
Central equatorial Pacific sea surface temperature (SST) anomalies (difference from normal) cooled over the past fortnight, continuing the decrease in the warm anomalies observed since late in 2016. However, the overall anomaly pattern remains similar to two weeks ago, with a large area of warmer than usual water extending through the central and eastern equatorial Pacific Ocean.
Warm anomalies continue to surround most of the Australian continent, with large regions greater than +1 °C to the north and south. Strong anomalies occur near Tasmania, with values of +2 °C surrounding much of the island.
The SST (sea surface temperature) anomaly map for February 2016 shows warm SST anomalies extending across the central and eastern equatorial Pacific. Compared to January, warm anomalies have decreased along the equator but have increased to the east of Australia and near the South American coast.
In February, the NINO3 region in the eastern Pacific cooled by 0.5 °C and the NINO3.4 region cooled by 0.3 °C, continuing the cooling trend initiated late last year. The NINO4 region remained steady. Values in the Bureau dataset for NINO3, NINO3.4 and NINO4 were +1.6 °C, +1.9 °C and +1.3 °C respectively, indicating a moderate El Niño event.
Warm anomalies persist over much of the Indian Ocean but have decreased in the south compared with January.
| Index | January | February | Temperature change |
| NINO3 | +2.1 | +1.6 | 0.5 °C cooler |
| NINO3.4 | +2.2 | +1.9 | 0.3 °C cooler |
| NINO4 | +1.3 | +1.3 | 0.0 °C No change |
Baseline period 1961–1990. Credit: BOM
The four-month sequence of sub-surface temperature anomalies to February shows a cooling trend in the warm sub-surface temperature anomalies in the central and eastern Pacific.
During February, warm anomalies were present in the top 75 m of the equatorial Pacific sub-surface, extending between about 170° E and the South American coastline. These anomalies have continued to cool since November. Cool anomalies in the western Pacific, around 100 m below the surface, now extend out to 120° W. They are expected to continue to migrate eastwards and cool the surface of the equatorial Pacific in the coming weeks, in line with the expected return to an ENSO-neutral state by mid-year.
Credit: BOM
After dipping to an event-to-date minimum of −23.6 on January 26, the 30-day Southern Oscillation Index (SOI) swung back to −9.0 in mid-February, before falling to its current value of −21.5 (March 13). Sustained positive values of the SOI above +7 typically indicate La Niña while sustained negative values below −7 typically indicate El Niño. Values between about +7 and −7 generally indicate neutral conditions.
.png)
Credit: BOM
Trade winds for the 5 days ending March 13 remain close to normal across the equatorial Pacific Ocean. The return to near-normal trade winds is consistent with a declining El Niño. Prior to January 2016, trade winds were consistently weaker than average, and on occasion reversed in direction (i.e. westerly rather than easterly), since the start of 2015.
During La Niña events, there is a sustained strengthening of the trade winds across much of the tropical Pacific, while during El Niño events there is a sustained weakening, or even reversal, of the trade winds.
Equatorial cloudiness near the Date Line has mostly been above average during March, as it has been since the beginning of autumn 2015. Recent values are closer to the long-term average.
Cloudiness along the equator, near the Date Line, is an important indicator of ENSO, as it typically increases (negative Outgoing Long-wave Radiation (OLR) anomalies) near and to the east of the Date Line during an El Niño event and decreases (positive OLR anomalies) during a La Niña event.
Model outlooks
All eight international climate models surveyed by the Bureau indicate central Pacific sea surface temperatures (SSTs) will continue to cool in the coming months.
Most models indicate a return to ENSO neutral during May to June, however, there is a considerable spread in the model outlooks by the end of winter with some models edging towards, or exceeding, La Niña thresholds and others staying firmly in neutral territory.
Source: BOM / ENSO Wrap-Up March 15, 2016.
Featured image credit: BOM
Commenting rules and guidelines
We value the thoughts and opinions of our readers and welcome healthy discussions on our website. In order to maintain a respectful and positive community, we ask that all commenters follow these rules.