New approach to estimate 15 years of CO2 emissions from burning fossil fuels
A new system, called the “Fossil Fuel Data Assimilation System,” (FFDAS) has been used to quantify 15 years of CO2 emissions, every hour, for the entire planet – down to the city scale.
An international research team led by ASU scientists has developed a new approach to estimate CO2 emissions from burning fossil fuels. Until now, scientists have estimated greenhouse gas emissions at courser scales or used less reliable techniques.
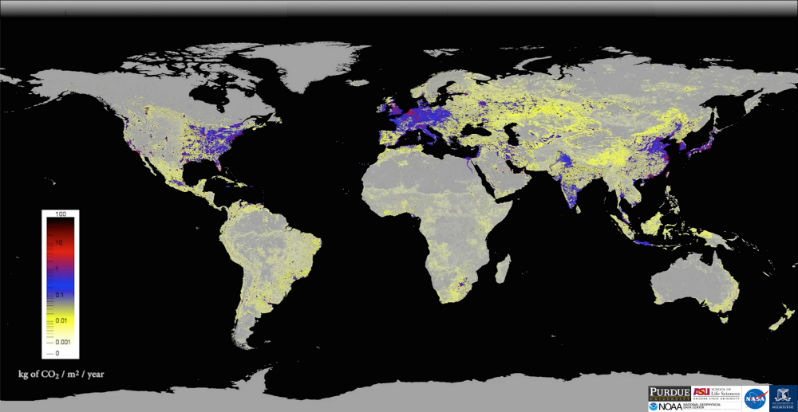
The FFDAS uses information from satellite feeds, national fuel accounts and a new global database on power plants to create high-resolution planetary maps which provide a scientific, independent assessment of the planet’s greenhouse gas emissions.
The research team combined information from space-based “nighttime lights,” a new population database, national statistics on fuel use, and a global database on power plants to create a CO2 emissions map broken down by hour, year and region.
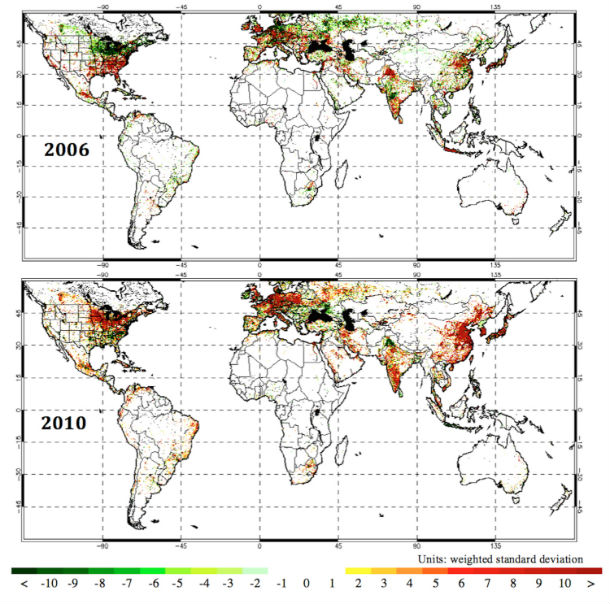
Annual FFDAS fossil fuel CO2 emissions anomalies for two years on either side of the Global Financial Crisis. (a) 2006; (b) 2010. Units: weighted standard deviation. (Credit: HPCG/Purdue)
The FFDAS showed surprising detail on global emissions before and after the Global Financial Crisis, with portions of the U.S., Europe and India recovering sooner and more dramatically. The multiyear results also showed the dramatic rise of CO2 emissions in China and South Asia.
According to Peter Rayner, lead investigator from the University of Melbourne, Australia:
It used to take years to assemble all the statistics on CO2 emissions. With this system, once the satellite data is flowing, we can update our emissions maps each year. It gives a quick check on efforts to limit climate change.
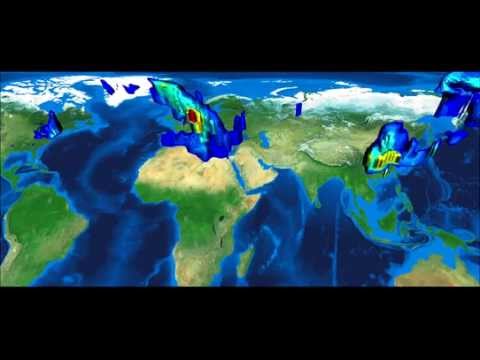
This video above provides an overview of the Fossil Fuel Data Assimilation System (FFDAS). This system quantifies fossil fuel CO2 emissions for the whole planet at 10 km every hour for the 1997 to 2011 time period. It shows both the fluxes of FFCO2 leaving the planet's surface and the realization of those fluxes in the atmosphere using an atmospheric transport simulation.
Researchers unveiled the new system in an article published September 10, 2014, in the Journal of Geophysical Research.
Find out more at Arizona State University
Check out FFDAS data retrieval map
Featured image: Global fossil fuel CO2 emissions as represented by the Fossil Fuel Data Assimilation System (FFDAS). (Credit:Gurney lab)
Commenting rules and guidelines
We value the thoughts and opinions of our readers and welcome healthy discussions on our website. In order to maintain a respectful and positive community, we ask that all commenters follow these rules.