Amazing supercomputer animation of Antarctic bottom water
The movements of the world's densest and coldest water around Antarctica has been simulated using Australia's most powerful supercomputer, Raijin, for the first time. Massive amount of data has been processed in order to create a highly detailed, remarkable animation, Arc Center of Excellence for Climate System Science reported on November 23, 2015.
The scientists have used a vast amount of data and a high-resolution ocean model to produce the animation. In fact, so much data has been used that, despite the supercomputer conducting the calculations, it has taken seven hours to process only one second of the animation.
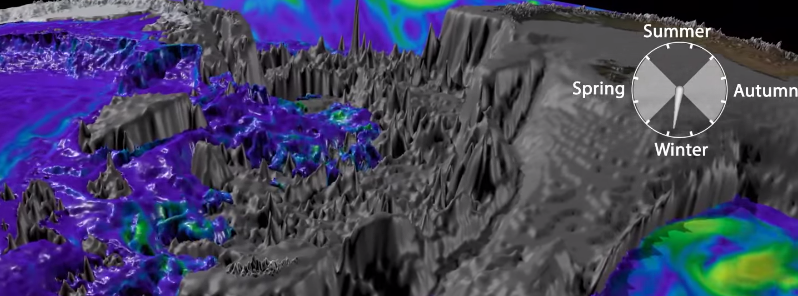
Resulting animation showed underwater ocean storms, generated by eddies, waterfalls of cold, dense water that plummet 2 km (1.2 miles) off the Antarctic Continental Shelf into the abyss and hundreds of meter high underwater waves.

Video credit: NCI National Facility
"Scientists who have seen the visualization have been astonished at the level of detail," said Chief Investigator Dr Andy Hogg from the ANU hub of ARC Center of Excellence for Climate System Science.
"But this visualization is about more than communicating the wonder of science to the public. Being able to actually see how the bottom water moves in three dimensions rather than just looking at numerical, two dimensional outputs has already opened new areas for scientific research."
The research is of high importance, as the water layer contains the most oxygenated water in the deep ocean and, because of its high density and low temperature, drives many of the significant currents in the major ocean basins connected to the Southern Ocean.
Differences in densities of waters around Antractica play an important role in climate change, as well. Because the most dense water forms near the surface, close to Antarctica before descending to the ocean floor, any warming that occurs near the surface can be drawn down into the deep ocean. The process then drives more heat and more carbon into the deep ocean, which would have returned to the atmosphere otherwise.
"The inhospitable climate of Antarctica and the lack of sustained observations of the ocean in this region over a significant period of time adds to the importance of using ocean models to create visualizations like these," Dr Hogg said.
"It helps us understand what is happening in locations that are difficult to observe and may explain why Antarctic bottom water is disappearing, becoming less saline and warmer. It may give us important insights into a future under climate change."
Featured image: Circulation of the Southern Ocean. Image credit: NCI National Facility
Commenting rules and guidelines
We value the thoughts and opinions of our readers and welcome healthy discussions on our website. In order to maintain a respectful and positive community, we ask that all commenters follow these rules.